Here are the historical values for levels of nitrogen dioxide (NO2) in the Botley Air Quality Management Area (AQMA) and other locations nearby.
In February 2016, Vale officer Tim Williams kindly took me on a tour of Botley, so I could see for myself the locations of the diffusion tubes currently in use. He shared his data with me, which I appreciate.
I’ve highlighted in yellow every location and year when the average reading exceeded the EU threshold (currently 40 micrograms per cubic meter). 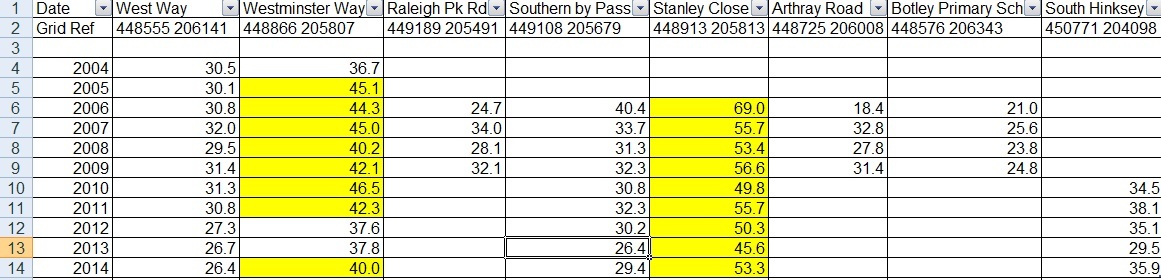
To make this table fit here, I’ve hidden two columns: Hutchcomb Road and Harcourt Hill. Hutchcomb Road is the baseline area. It’s still tracked but figures there are under 20. Harcourt Hill was only measured for 2 years (2010-11) and figures there were under 30.
Many people express concern about Botley School. Their figures are in the table above. Figures were consistently low, so measurement ceased after 2009.
Here’s the map of the Botley AQMA. In the green areas, our air pollution is or has been above EU limits.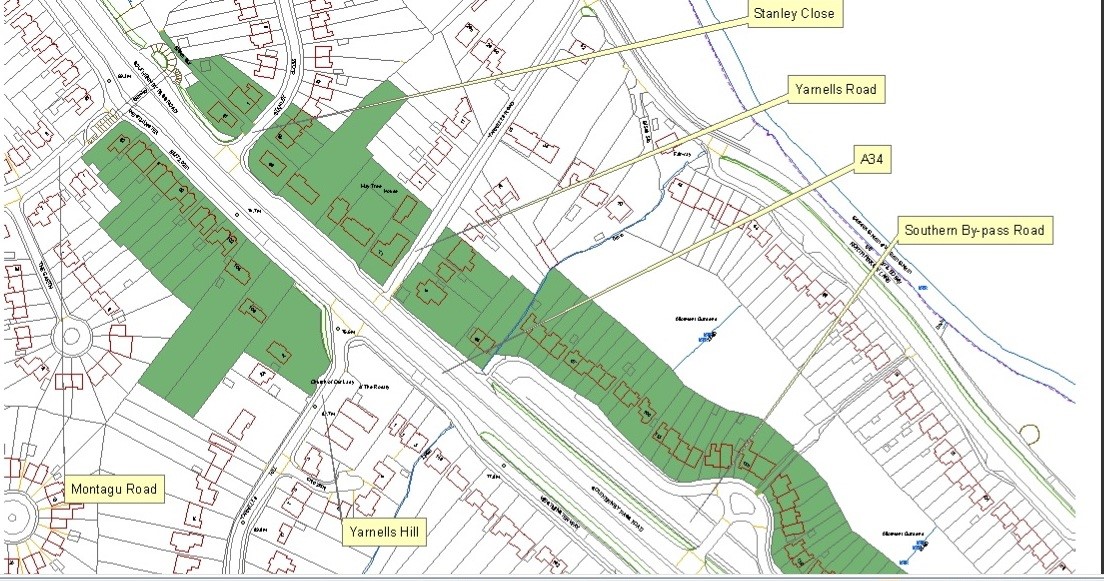
For more information on Vale Air Quality, see the Vale’s website: http://www.whitehorsedc.gov.uk/services-and-advice/environment/pollution/air-quality/how-we-monitor